
Introduction
Despite ongoing calls for recession and a dip in equity markets by many economic and investment strategists across the Street, both the economy and the stock market have remained resilient through the first quarter of 2024. While valuations have expanded and returns have already been attractive, we have reasons to remain bullish about the market and economy going forward. While a short-term pullback may not be out of the question, there are dynamics providing an attractive setup for markets over the next few years. Please enjoy this edition of our quarterly newsletter, where we will cover:
- A Resilient Market – What Happened in Q1
- The Fed’s Ongoing Mission to 2% Inflation
- Redesigning the Traditional “40” of a 60/40 Portfolio
- Election Year 2024 – What it Means for Markets
- The Move Away from China – International Investments
- The AI Revolution Continues
- Crypto – What You Need to Know
A Resilient Market
Just as they did at the beginning of 2023, recession calls came to the forefront of forecasting conversations for the U.S. economy in 2024. While many economists predicted a significant slowdown in the domestic economy, the reality has been the opposite – GDP growth has remained resilient, consumer spending has been strong (particularly in services sectors), earnings growth has been attractive, unemployment has stayed low, and economic activity has persisted. These dynamics, coinciding with the peak of the rate hiking cycle (with rate cuts on the horizon), have led to attractive market returns year-to-date.
- The S&P 500 is up almost 10%
- The Nasdaq is up roughly 9%
- Even the Dow is up 4.5%
Fundamentals have looked good, and earnings season came and went with mostly positive results. Market valuation metrics have advanced, however, and it makes sense to take a sector-by-sector and company-by-company approach to investing. The market-cap-weighted indices may have trouble finding substantial new highs over the rest of the year, but we believe there are plenty of individual companies that can benefit from ongoing megatrends and market forces.
The Magnificent 4
Just as March Madness brings the end to many collegiate basketball seasons, Q1 narrowed down the Magnificent 7 to its own Final Four – Nvidia, Microsoft, Meta, and Amazon – leaving Alphabet (Google), Apple, and Tesla to dream of next season. The Mag 7 members drove the S&P 500 in 2023 but are having a mixed impact in 2024. We continue to view the outlook as positive for the year-to-date winners (NVDA, META, AMZN, MSFT), and more neutral for GOOGL, AAPL, and TSLA. The AI revolution continues to drive these companies, and the leaders are taking advantage of this megatrend that is proliferating in the market.
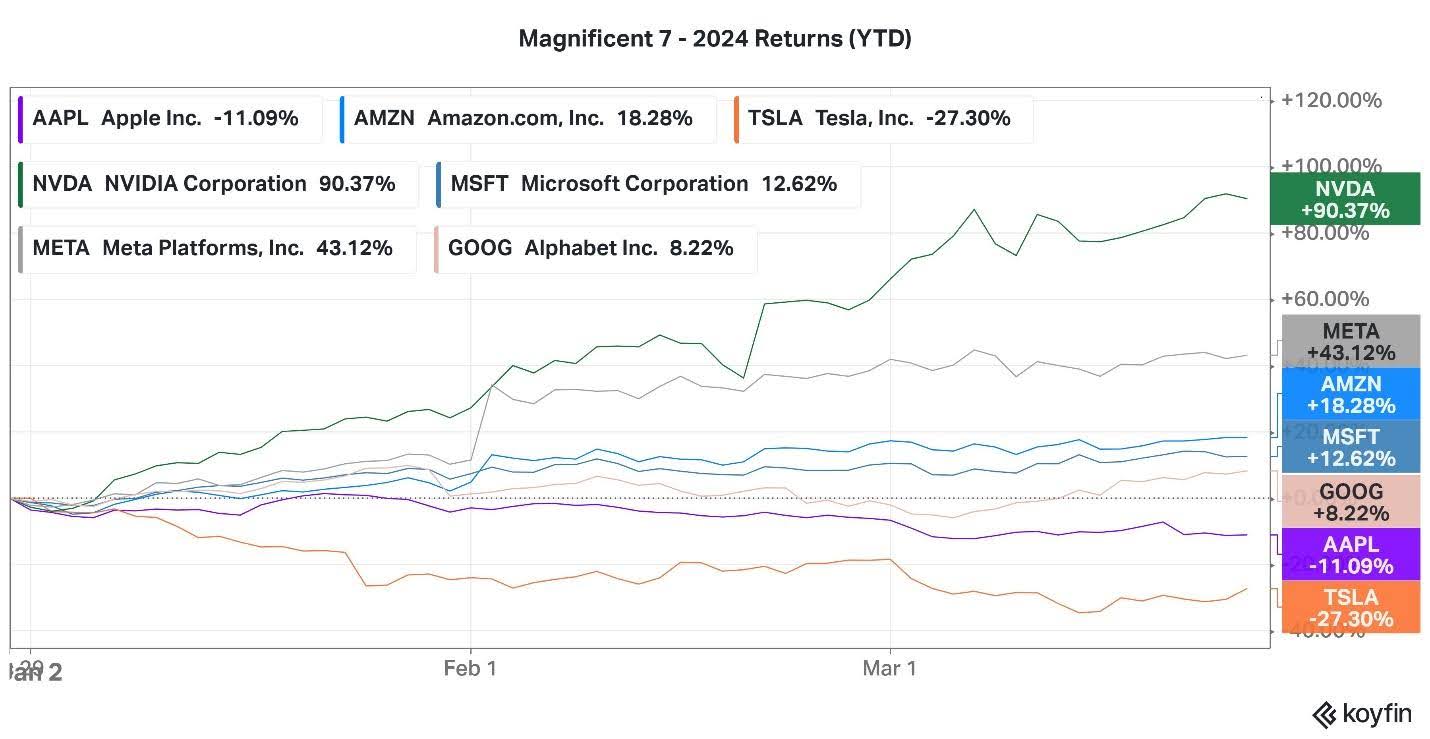
Past performance is not a guarantee of future results. Investing involves risks, including the loss of principal. Current performance may be more or less favorable than shown.
While we continue to believe these mega caps will perform well this year, the coming interest rate cuts from the Federal Reserve should broaden the market rally.
Broadening of the Market Rally
The Magnificent 7 were the drivers of the market in 2023, but we have reason to believe the market rally will broaden going forward. The equal-weighted S&P 500 and Russell 2000 have lagged the market-cap-weighted S&P considerably over the last 15 months, but as rate cuts begin to ease financial conditions, we believe the market will show more love to smaller companies.
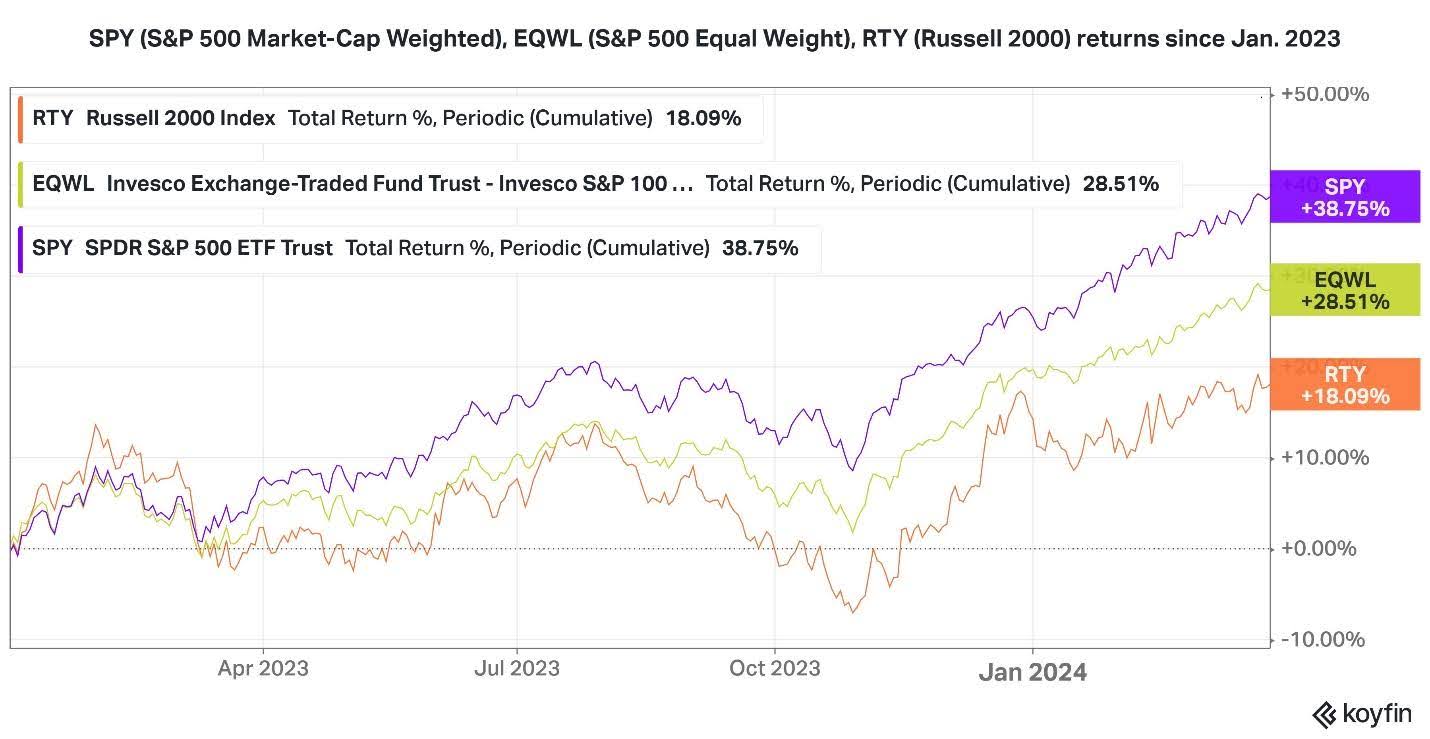
Past performance is not a guarantee of future results. Investing involves risks, including the loss of principal. Current performance may be more or less favorable than shown.
Why, you may ask? We arrive at three primary factors:
- Safety Unwind – In 2023, market participants moved cash into larger companies as a flight to safety. As investors continue to feel increasingly comfortable in our current economic environment, this safety premium will dissolve, allowing investors to reposition into mid-cap and small-cap equities.
- Lower Interest Costs – Debt burdens are expected to reduce as interest rates are cut. Smaller companies are typically more debt-laden than large caps because they utilize that debt (often floating-rate debt) to fuel future growth. With the increase in interest rates over the past two years, small and mid-cap companies have been disproportionately impacted by interest costs. Once the Federal Reserve begins reducing interest rates, debt financing will become cheaper, and margins should expand, leading to a better earnings environment.
- Attractive Valuations – Valuation metrics currently look more reasonable for small and mid-cap companies. P/E ratios have expanded significantly for many of the larger companies in the market, meaning earnings growth will have to do most of the legwork going forward to increase stock prices. We believe smaller companies could see valuations expand along with earnings growth.
For these reasons, we prefer the equal-weight S&P 500 over the market-cap-weighted index right now, although we still believe a company-by-company approach is more prudent. When it comes to the broader market environment however, we feel confident that the backdrop will allow for modest market returns across capitalization sizes – the Fed is nearing its inflation target, and slow but sustained interest rate decreases should create a tailwind for securities over the coming years.
The Fed-Driven Market
The past couple of investing years have been all about the Federal Reserve – How high will interest rates go? How long will they stay there? When will the first rate cut take place? – These have been some of the most common questions on the minds of investors and security analysts over this market cycle, and for good reason. Interest rates drive so much economic activity – the lower interest rates are, the more likely consumers and businesses are to borrow and, therefore, spend. The Federal Reserve raised interest rates to cool down the economy and bring inflation back down to their 2% target, and now that they are coming closer to that target, the last of those important questions is most in the limelight.
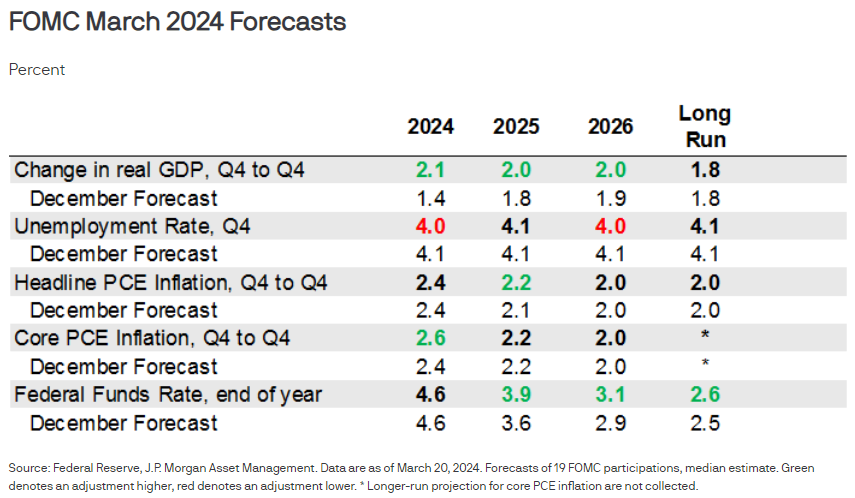
At the Fed meeting on March 20th, the Federal Reserve presented investors with a new set of economic projections. Most importantly, they signaled an ongoing intention to cut interest rates three times this year. However, interest rates weren’t the only key data provided by the Fed – they also increased expectations for GDP growth and lowered expectations for unemployment. The fact that the Fed is still willing to cut rates three times while acknowledging continued economic strength was a key signal for the market that the Fed won’t seek economic destruction to achieve 2% inflation. Jerome Powell, President of the Federal Reserve, acknowledged in his press conference that economic growth can remain resilient while inflation returns to 2%. This contrasts starkly with last year when he stated there needed to be some “pain” in the labor market to achieve 2% inflation once again.
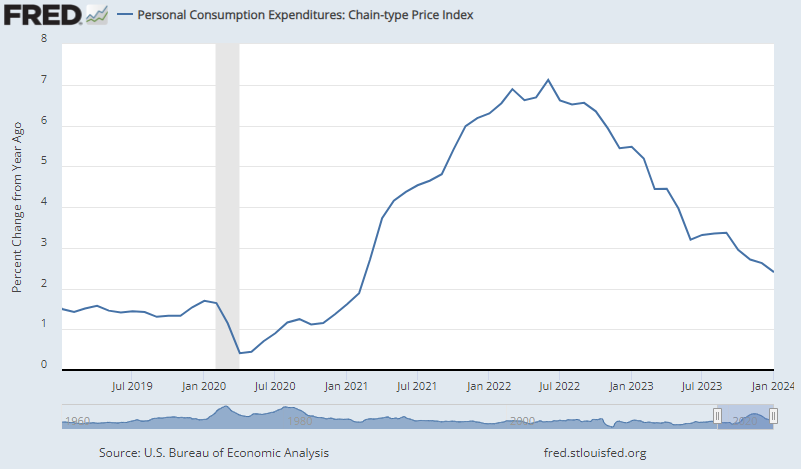
Where are we in the inflation fight?
PCE inflation, the Fed’s preferred inflation gauge, came in at 2.5% year-over-year for the month of February. Core inflation (excluding the volatile Food and Energy segments) came in at 2.8%. While we are not yet at the ideal 2% level for the Fed, we have come extremely far since PCE inflation peaked at over 7% in 2022. The Fed feels monetary policy is sufficiently restrictive to continue the glide path toward the 2% target and is now eyeing rate cuts to avoid overshooting inflation to the downside.
As we’ve written about before and mentioned on a recent episode of the Beckonomics Podcast, we believe that the ongoing major contributor to inflation, shelter prices, is likely to come down over the coming months. As inflation continues to decline, the Fed should feel comfortable lowering interest rates and providing easier monetary conditions for the economy. While this process will be slow and steady, we believe it will provide a modest tailwind for our investments over the coming years.
Redesigning the Traditional “40” of a 60/40 Portfolio
Ever since Harry Markowitz, Nobel-prize-winning economist, developed Modern Portfolio Theory in 1952, financial advisors have notoriously preached the 60/40 portfolio as a way to achieve the bulk of stock market returns while lowering volatility. This system worked during the 40 years of falling interest rates from the 80s up until the 2022 Fed hikes but became a burr in many investors’ sides when they witnessed both their stocks and the bonds (that were supposed to offset equity declines) fall substantially in 2022. Beck Capital remained essentially out of traditional fixed income in 2022 because when interest rates were 0%, there was only one direction for them to go – up. Now that interest rates have returned to levels where fixed income is generating a real return (positive after accounting for inflation), we have incorporated some traditional bonds but are reinventing this “40” of the portfolio with what we view as more attractive income-oriented volatility dampeners in the portfolio. Among these are Defined Parameter Investments, structured notes, private credit, and real estate. We view these vehicles as attractive ways to diversify a portfolio while still seeking high returns for our investors.
Defined Parameter Investments – these investments are linked to market returns, but provide buffers to the downside, typically in the 10-15% range, while limiting returns up to a cap to pay for that protection. When the market returns as much as it has in the past 15 months, there is higher downside risk, and we view protection from the downside as prudent, even if it could potentially cost some upside. We believe higher interest rates and volatility over the past year have made these vehicles increasingly attractive, providing higher return caps that we think are unlikely to be reached by the S&P 500 over the next 12 months.
Structured Notes – Similar in structure to Defined Parameter investments, we design our own structured notes, linked to index returns, that provide passive income or lump sum returns over a designated period. By laddering these around the calendar, we are able to provide some protection during turbulent markets while also generating attractive returns. Typically 13 months in duration, the majority of these investments qualify for long-term capital gains.
Private Credit – A proliferating alternative in and of itself, Private Credit investments have become a way to earn passive income. Following the substantial interest rate hikes by the Federal Reserve, banks pulled back on lending to shore up their own balance sheets, so many companies turned to private lenders for more flexible borrowing situations. Unlike traditional banks, private lenders also typically work with borrowers to improve their businesses, thus better ensuring the payback of interest and principal. Private Credit spreads above government yields are substantial, so although these are typically floating-rate loans, they should distribute high single to low double digits even after several interest rate cuts.
Real Estate – Public and private real estate have also emerged as ways to profit from a combination of passive income stream and principal appreciation once the Fed begins cutting rates. We are currently avoiding the most volatile commercial real estate sectors, like office space, and are focusing on quality property portfolios that are cash-flowing and have the opportunity to see capital appreciation over the coming years.
Corporate Debt – Although corporate debt is not our favorite fixed income asset class right now, it has a place in portfolios for more stable fixed income exposure. Corporate bonds are once again providing modest returns and should provide some stability in the event of a market pullback. Our preferred corporate debt sectors are non-cyclical and non-bank debt.
The “40” portion of the 60/40 portfolio may have lost its appeal for many investors in 2022, but we are reimagining how volatility-damping fixed-income-oriented solutions can be incorporated into portfolios. The silver lining of higher interest rates today is that they provide ample opportunity in the alternative credit space for us to achieve favorable, passive yields for our clients.
Election Year 2024
If you attended our Election Year 2024 Webinar, you got an in-depth preview of this topic. The recording can be accessed here.
The coming of a new presidential election year brings an extra element of uncertainty to markets. Frequent headlines regarding the course of the election and its potential impact on the economy can be very distracting. This uncertainty may bring investing opportunities, but as we’ll outline, it’s important to maintain a disciplined approach in one’s portfolio.
What does History Tell Us?
History gives us some data when it comes to investing in an election year, but not many conclusions can be drawn from it. On average, volatility is typically higher in election years, and returns are typically lower, but recent election years have been riddled with Black Swan events – namely the 2000 Tech Bubble, the 2008 Financial Crisis, and 2020’s COVID-19 Pandemic. Adjusting for these events, election year markets look very similar to any other year. Additionally, power dynamics between the House, Senate, and Executive branch don’t create many statistically significant outcomes either. As can be seen in the chart below, mixed government appears to be best, but average returns are positive across all combinations of government.
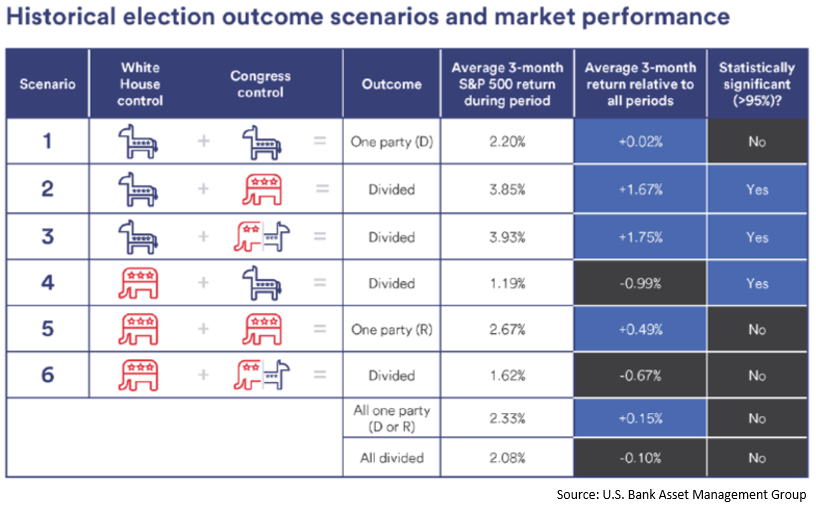
What does matter when it comes to government control?
While the broad market may act relatively normally under any political combination, an administration can enormously impact specific sectors. The energy, healthcare, technology, and industrial sectors are particularly exposed to new administration changes. At Beck Capital, we have prepared a version of our portfolio for either outcome of this year’s election and will invest accordingly, placing in-favor sectors and companies in our portfolios while excluding those that may be negatively impacted by an administration’s policy agenda.
India, Mexico, and Japan
Here at Beck Capital Management, we approach foreign investment differently than most. We apply our 30,000-foot view not only to pick which sectors will benefit from macroeconomic forces but also to where those forces will drive investment and returns. Instead of a scattershot approach that involves investing in all of the major economies, we’re focused on growing economies that are the center of increased foreign direct investment. We’ve written about Mexico and India previously but have recently added Japan to our focus list for some similar reasons, as well as its own economic promise.
India and Mexico have been centers of foreign investment as supply chains have been “near-shored” and “friend-shored” in response to increased international tensions and supply chain disruptions. Given the United States’ strong trade ties and similar governmental structure, India is a compelling choice for offshore manufacturing in the Asian continent. As trade relations with China have become strained over time, many companies have left China in favor of India for the same combination of inexpensive labor and proximity to existing trade routes.
Mexico has seen a similar expansion in recent years. An expansion kicked off by the US-Mexico-Canada (USMCA) trade agreement was put into high gear following the supply chain breakdown during and after COVID-19. By “near-shoring” supply chains, they’re made more insulated from external factors like those seen during 2020 and current geopolitical tensions like the trade disruptions in the Red Sea.
Increased economic activity leads to increased profitability for many local companies, from those in India manufacturing Apple’s iPhones (previously made in China) to those building the roads, buildings, and homes supporting further expansion. An influx of foreign investment also drives demand for local currency, thereby strengthening these foreign currencies.
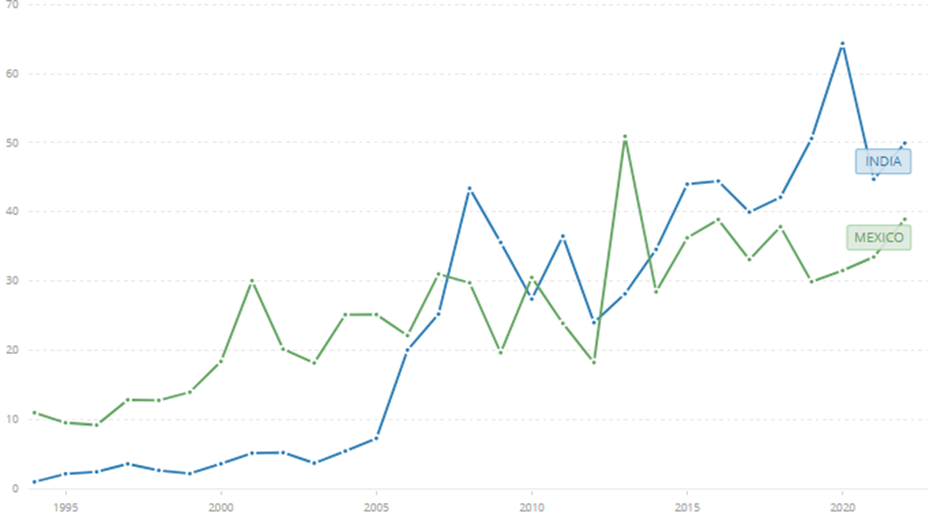
Foreign Direct investment in India and Mexico, net inflows, current US dollars – The World Bank
Japan is experiencing many of the same macro forces but has also recently made some internal changes that will likely spur its economic growth.
- For the past eight years, Japan has been one of the only countries with negative interest rates, until March 19th when the Bank of Japan (BOJ) hiked interest rates to 0%.
- While the move from -0.1% to 0% rates will do little to hamper growth, it will likely result in currency appreciation, as is normal under a rising-rate regime.
- Japan has over $14 trillion worth of household savings, most of which are sitting in cash. The Japanese government is pushing its citizens to move that into their stock market. A combination of modest inflation and rising economic activity will aid this push.
- For many years, Japan has faced an issue opposite to the one the US Federal Reserve is currently battling – low and negative inflation. Economies run best with slight inflation (which is why the Fed’s target inflation rate is 2%, not 0%). Japan averaged below 1% between 2015 and 2022. For the past two years, Japan has experienced inflation above 2%, and the BOJ has finally become comfortable with marginally increasing interest rates.
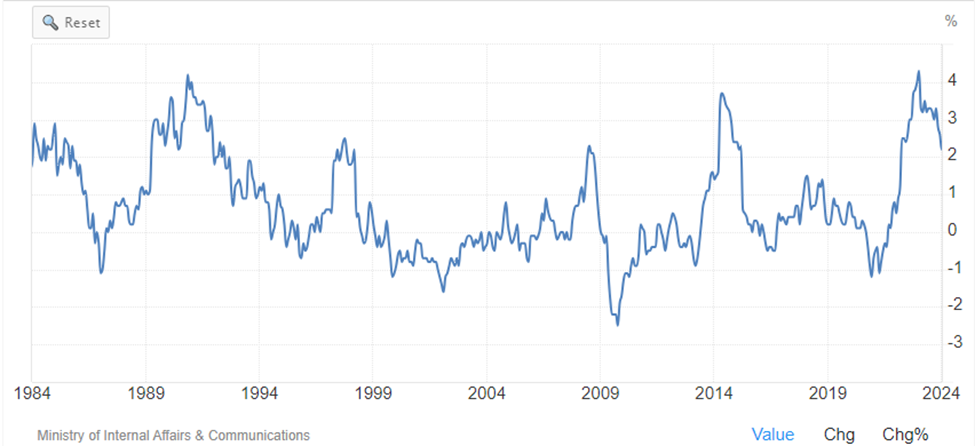
Japanese inflation since 1984
AI
Artificial intelligence remains at the forefront of the macroeconomic discussion, with some of the most prominent AI companies seeing their stock prices more than double over the past year. Some call it a bubble, but looking at the products and earnings being generated, we’d call it the latest technological revolution.
Taking Nvidia as an example, its price has increased approximately 230% over the past year, while earnings have grown about 390% – meaning Nvidia has actually gotten cheaper from a valuation perspective since the AI “bubble” began. After its most recent earnings, Nvidia had a forward price-to-earnings (P/E) ratio of 32 times, which is well above the S&P’s 21.5, but when incorporating the rapid growth of Nvidia via a PEG (Price/Earnings/Growth), it is actually cheaper than the index.
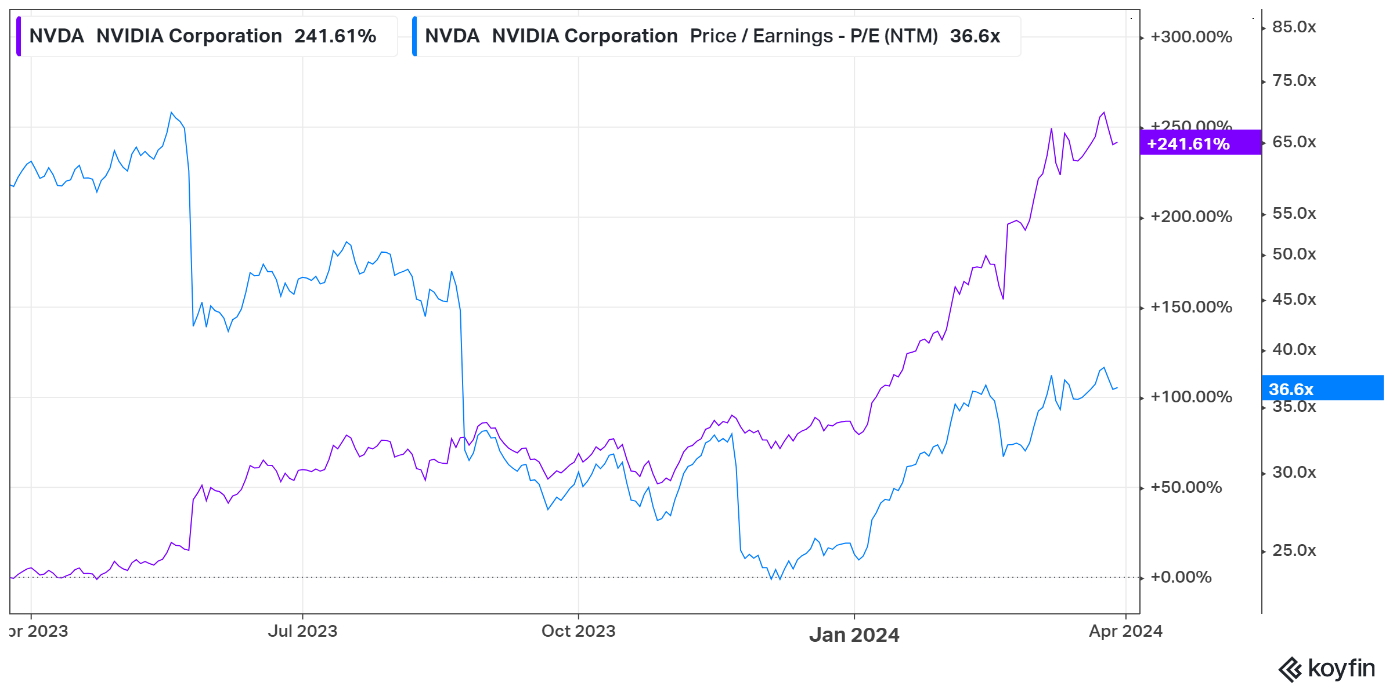
NVDA’s P/E has dropped despite the rapid increase in price.
The AI space is divided into hardware and software companies; those building the immense infrastructure required to train these models have been the initial beneficiaries of the AI boom, while the software companies are still investing in these systems and capabilities. We are still focusing our investments on the hardware companies cashing checks until software companies reach levels of AI complexity and market adoption that will drive future earnings. Since our last update, money has continued to pour into the infrastructure required for these systems; some examples are:
- Blackstone, through their recent acquisition of QTS, is investing $25 billion to build new data centers, as the need for this space has reached an all-time high.
- Jensen Huang, CEO of Nvidia, expects the amount of data center infrastructure to double to $2 trillion over the next five years.
- Energy companies have warned that electricity needs will increase substantially due to further electrification and the increasing demands of these data centers.
While necessary infrastructure is currently the center of our attention, more companies have been rolling out mass-market AI tools with capabilities that go beyond relatively simple chatbots. Adobe, for example, has many advanced AI integrations to make photo editing faster and easier, and recently released PDF reader tools that allow AI systems to read and summarize PDF text. Adobe Reader is the world’s most popular PDF software, bringing this capability to millions of potential customers. As more and more AI solutions like these make their way into the market, we’ll be watching and potentially adding exposure to that segment of AI stocks.
Crypto
Since our 2024 Outlook, where we discussed the upcoming Bitcoin ETFs, they’ve launched and seen record ETF volume. With the introduction of these new products, we’ll be doing a quick dive into the weeds to explore how they work. We’d like to answer some questions about the effectiveness of these ETFs, their security, and the benefits or drawbacks of owning ETFs versus buying and holding Bitcoin directly.
Bitcoin Price Tracking – by buying and selling actual Bitcoin, these ETFs can near-perfectly track the Bitcoin spot price. As orders are placed, the ETF sponsors buy/sell Bitcoin through their custodians to back/fund the orders.
- A few major cryptocurrency exchanges act as custodians to the Bitcoin ETF sponsors, acting like Fidelity or Schwab do for investment accounts. Coinbase ($COIN) acts as the custodian for most ETFs.
- Previous ETFs were limited to Bitcoin futures, which didn’t perfectly track Bitcoin’s price. The spot ETFs have fixed this issue.
Security – Asset security is a significant concern for all commodity-backed ETFs, including Gold and Bitcoin. Bitcoin doesn’t face the same storage costs as physical gold but requires safety mechanisms to ensure it is not exposed to fraudulent accounting or cybercrime.
- Proof-of-reserves is a system where investors can actively view the Bitcoin holdings of an ETF directly on the Bitcoin blockchain. Like being able to view a savings account balance publicly, some ETFs will post their public wallet addresses, allowing investors to directly ensure that the amount of Bitcoin owned by the fund is exactly the same as the published net asset value (NAV)
- Cold Storage – while some Bitcoin must be liquid to fulfill sell orders, the majority of ETF Bitcoin balances are held in something called “cold storage”. This means that while the assets still exist on the blockchain, the “private key” (essentially the account’s password) is stored offline, where they can’t be accessed by unauthorized parties.
- Security is ensured by the custodian and insured by a syndicate of industry-leading insurers.
Benefits – Benefits versus directly holding Bitcoin
- Bitcoin ETFs simplify the purchasing process, allowing Bitcoin to be bought and held directly in investment accounts without the difficulty of opening separate accounts through third-party crypto custodians.
- Bitcoin holdings are potentially more secure than holding crypto directly due to the security measures in place versus maintaining and securely storing one’s own individual passwords. Self-custody of crypto assets increases flexibility for the holder but exposes an investor to potential losses associated with lost or stolen private keys (Bitcoin doesn’t have a reset-password option or help desk like an investment account does)
Drawbacks – Drawbacks to ETFs versus self-custody
- Bitcoin in investment accounts cannot be redeemed “in-kind,” meaning that it must be sold and withdrawn as cash versus redeemed for Bitcoin itself.
- ETFs cannot be directly transferred or used for payments, such as Bitcoin allows.
Crypto is a complex asset class, and one of growing importance in the financial world. Understanding how these ETFs work is an important first step when making an investment decision or holding these types of assets.
Conclusion
It has been an excellent first quarter of 2024. While markets have grown to rich valuations in the near term, we still have reasons to be bullish over the next few years. Macro trends, like the beginning of Fed interest rate cuts and the AI technology revolution, should help drive specific sectors of the market forward. We favor being selective in this market cycle and will be constantly analyzing the economic environment to best prepare our portfolios for what comes next.