Intro
As we head into the final quarter of the year, all eyes remain on the Federal Reserve (Fed) and its interest rate decisions on its mission to rein in inflation. We remain cautiously optimistic in the current environment and continue to position portfolios in a way that benefits from near-term volatility. In this quarter’s update, we will discuss:
- An update on the Fed and where they stand
- The disinflation wave continuing
- The case for looser monetary policy to bring down inflation
- The resilience of the U.S. economy
- Our oil thesis playing out
- What we’re watching in Q4
Updates on the Fed – Powell Softens Markets
Much to the market’s dismay, Powell delivered hawkish rhetoric and mixed signals at the most recent Federal Open Market Committee (FOMC) meeting on September 20th. What made this meeting particularly impactful was the deliverance of an updated Summary of Economic Projections (SEP), more commonly known as the “Dot Plot.” The SEP provides insight into the Fed presidents’ forward thinking with regard to interest rates, inflation, GDP, and unemployment. In comparison to the previous SEP, the updated projections showed anticipation for:
- Higher interest rates at the end of 2024
- Lower inflation expectations
- Higher GDP
- Lower unemployment
The biggest question we (along with many market strategists) had coming out of this meeting was: “Why raise interest rate expectations while lowering inflation expectations?” The Fed views interest rates as a counter to higher inflation, so therefore, wouldn’t it make sense to lower interest rate expectations if inflation expectations are lower? That’s what we would assume. This is where the Fed’s conflicted messaging began.
The press conference, unfortunately, didn’t yield much clearer messaging. Powell brushed off a few high-quality questions from the press and left viewers a bit confused about the Fed’s forthcoming approach to its inflation flight. Powell contradicted himself several times while noting that a soft landing for the economy was “not the base case” but was also “the goal.” The next day, markets fell hard, marking the first day in over 100 that the S&P 500 fell more than 1.5%.
From our perspective, we believe investors gain little by trying to read into the Dots. The Fed will remain data dependent, as they have up until this point, and we have plenty of reasons, as we’ll discuss, as to why the disinflation wave will continue. A continued drop in inflation will force the Fed’s hand, and they will have to drop rates sooner than they indicated in the SEP. Volatility in the near term is uncomfortable, but it presents us with attractive buying opportunities on assets we like. We plan on setting up our portfolios now to take advantage of anticipated changes over the next two years.
The Disinflation Wave Continues
Core CPI disinflation has continued to progress in recent months: annualizing the last three month-over-month changes, the U.S. economy is experiencing 2.8% core inflation, a level we think should satisfy the Fed. The Federal Reserve continues to state 2% inflation as its end goal, but we believe that once CPI & PCE come into the 2-3% range, they will be comfortable declaring victory and will loosen monetary policy. In our view, inflation will continue to roll over as a fresh wave of disinflationary pressures enters the market in the form of lower transportation and shelter costs.
Goods inflation has been slightly negative in the past few months and currently sits at 0.2% over the last 12 months, so the current inflation problem sits squarely within the Services sector – specifically Shelter and Transportation Services.
Transportation Services have been inflating more quickly than other sectors – up 10.3% YoY (as of August CPI). Driving the increase is Vehicle Maintenance and Insurance, with low Airline fares helping temper the total Transportation Services category. Transportation inflated at 1.0% and 1.9% month-over-month rates in August and September of ’22, respectively, and Core CPI inflation should moderate as these months roll off. This is notable but relatively unimportant to the broad Fed picture because the category accounts for so little consumer spending and only 7% of Core CPI inputs. Shelter, on the other hand, accounts for roughly 42% of Core CPI.
Shelter is the last major holdout of high inflation, and it is starting to roll over. Over the past few months, shelter prices have begun to creep downwards, only inflating at 0.4% month-over-month in June and July and 0.3% in August (or 4.4% Q3 annualized, versus 7.3% over the last 12 months).
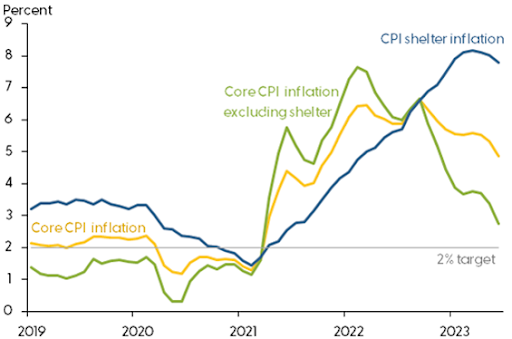
The CPI measures existing rental rates in the market, not just new leases being signed, so it inherently works on a lag. We’ve seen marked disinflation in the category, as the August month-over-month increase was 0.3% versus 0.7% in August through October of last year. As these high-inflation months from 2022 start to roll off, this will have a robust disinflationary effect on the CPI. For example, if Shelter immediately moved to 4.4% annualized, overall Core CPI would measure about 3-tenths of a percent lower to 4% YoY.
Source: Federal Reserve Bank of San Francisco
The Case for Looser Monetary Policy to Bring Down Inflation
While it flies in the face of traditional economic policy and the current Fed playbook, we believe that inflation might actually fall faster if the Fed were to reduce its policy rate. This is not to say that inflation won’t return to “acceptable” levels without lower rates, but that a decrease in rates could expedite this process.
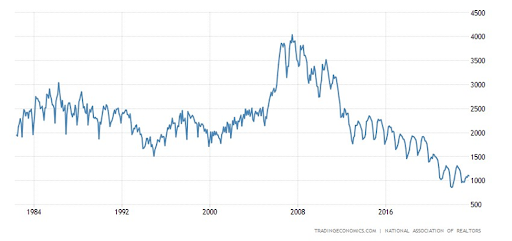
As discussed above, Shelter is the largest remaining bucket of inflation left to tackle, and home prices are by far the largest input to CPI via Owners Equivalent Rents (OER). The broad Shelter category is divided between Rents and Owners’ Equivalent Rents (OER), with OER being over 3x more heavily weighted in the CPI Calculation than actual rentals.
Home Prices (and thus OER) are being propped up by several factors:
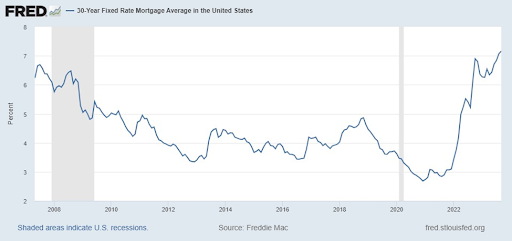
Existing Mortgages
30-year Mortgage rates are now firmly above 7%, whereas they’ve been below 5% since 2009, dipping all the way below 3% at the end of 2020 and into 2021. This has created what’s known as the “Golden Handcuffs” effect for many existing homes – it is cost-prohibitive to sell a house with a 3% mortgage and move into another at 7%. For this reason, the supply of existing homes on the market is at an all-time low.
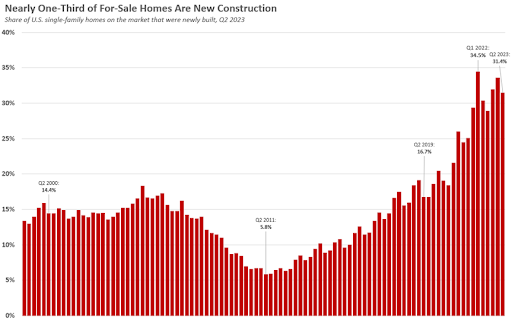
New-Builds
New homes are an increasingly popular option for homebuyers, with homebuilders buying down rates by 1% or more, which creates a new set of issues for home prices. Not only are new homes inherently more expensive than the average existing home, but homebuilders are raising prices to offset the costs of buying down rates to make their homes look relatively more attractive. New-builds now account for approximately one-third of homes on the market, versus 15-18% pre-pandemic, according to Redfin.
Historic Low Supply
Despite an increase in newly built homes on the market, housing supply remains near historic lows.
Continuing Demand
Demand for homes generally follows GDP, and U.S. GDP has remained resilient throughout the tightening cycle. High interest rates are doing less to temper demand than to delay it. There’s plenty of demand for homes at lower interest rates, but until mortgages are more affordable, we’ll be seeing lower housing volumes turn over at higher prices.
This leaves the Fed with a decision – lower interest rates to ease supply constraints (something they don’t seem interested in, based on the latest FOMC meeting) or use monetary tightening to further cool the economy in hopes of tempering demand.
The U.S. – A Resilient Economy Despite Fed Headwinds
Despite the Federal Reserve’s actions to dampen economic activity via higher interest rates, the economy continues to chug right on. The labor market is strong, GDP growth has been revised upward, business activity surveys have held up, and corporate earnings have continued to grow.
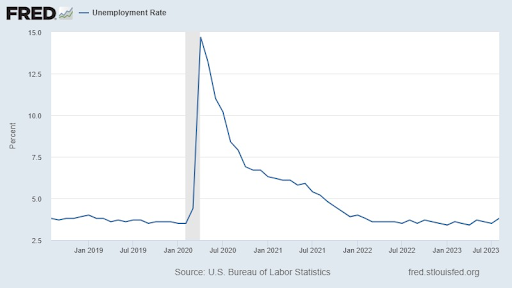
A Strong Labor Market – Giving the Fed Runway to Raise
A strong labor market is traditionally a great sign for the U.S. economy – economic activity is robust, leading companies to grow and hire more workers. In the 2023 economy, however, this resiliency has been met with mixed emotions as it allows the Fed to hike rates further. When it comes down to the basics, the Fed has a dual mandate: 1. To maintain price stability (keep inflation moderate) and 2. To foster maximum sustainable employment (keep unemployment low). When one of these is out of balance, the Fed will act by changing interest rates or managing its balance sheet through open market operations (buying or selling bonds). Lower unemployment and fewer job losses have given the Fed the ability to continue rate hikes today. We still view lower unemployment as a positive, however, as a strong labor market fosters economic growth much better than a weak one.
Corporations – Holding Up Among Fed Headwinds
Year-to-date, U.S. corporations have held up well. 79% of S&P 500 companies exceeded EPS estimates during Q2 earnings reports and 45 companies provided positive EPS guidance for Q2, the highest number since Q3 2021[1].
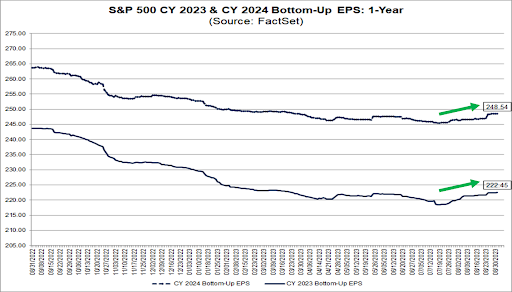
The Fed’s rate hikes have made new borrowing prohibitive, but corporations are focusing on the retirement of debt and cost-cutting initiatives in these harder economic times to protect bottom lines. Further, corporations made sure to take advantage of low rates pre-2022 to extend liabilities several years in the future. The bulk of retiring debt in corporate America doesn’t mature until 2025 and 2026, giving corporations the benefit of lower debt burdens over the next year and a half, at which point the Fed will likely have moderated rates to a more attractive level for refinancing. The cost-cutting initiatives put forth by corporations, along with productivity increases facilitated by AI, give us confidence in the runway for corporate earnings over the next few years. Hard times make for stronger companies, and once interest rates return to a more stimulative level, it should reflect positively on companies doing the work now to ensure better performance in the future.
Oil on the Rise
After calling for oil prices to rise due to macro and micro factors outlined in our previous newsletter, along with last year’s oil exclusive, we are now seeing our investment thesis playing out. Several factors have contributed to growing prices for WTI, and the Energy stocks that benefit have followed.
The OPEC Put
OPEC+ production cuts have created a strong foundation for oil prices over the summer months and have allowed energy prices to take off as of late. OPEC’s production cuts have amounted to 3.66 million barrels per day (mbpd). For comparison, global oil consumption is estimated to be just shy of 102 mbpd. This significant reduction in output, combined with increased demand in the Summer months, has pushed crude to surge over the quarter. All eyes are on Riyadh now, as Saudi Arabia will drive further discussion of cuts through the course of 2024. The Saudis have already extended some cuts through the end of 2024, so it remains unlikely OPEC+ countries will show substantial production expansion from here.
A Confluence of Factors
Energy investors, as of late, don’t just have OPEC+ to thank. U.S. oil rig counts have dropped precipitously of the last few months, and many strategists believe production has peaked for the medium term. U.S. oil companies are happy to return cash to shareholders in the current environment of high regulatory scrutiny. Russia continues to struggle to meet output targets and has announced 300k bpd of output reductions in the near term – we continue to believe that without support from Western nations, Russia will be incapable of maintaining its desired output. Finally, China continues to boost economic activity through fiscal and regulatory stimulus. We expect the resurgence in Chinese demand to continue. The output vs. demand gap continues to widen:
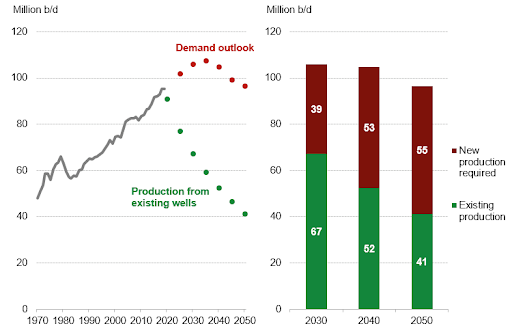
Source: Bloomberg
Oil Price Risks
While we believe Energy equities are poised to benefit from higher prices in the near term, we would be remiss to not note risks to that thesis. If OPEC were to abruptly increase production targets, supply would increase and depress prices. On the demand side, if a global slowdown created by high interest rates were to be worse than expected, business, as well as consumer activity, could moderate demand enough that prices fall. Neither of these is in our base case but will be monitored closely in our ongoing energy sector analysis.
What We’re Watching in Q4
Bond Yields
Bonds may finally be back. After years of low yields and meager returns, bond yields have finally reached a level where they deserve portfolio implementation. As of late, we have dipped into investment-grade corporate bonds as a low-volatility position in our portfolios that drives a respectable return. As the year continues, we aim to build out a bond position, seeking to lock in the market’s attractive current rates. We expect the Fed to cut interest rates in 2024 and 2025, which will drive principal appreciation for these positions along with the passive yield that they generate.
Q3 Earnings
Q3 earnings season (primarily landing in late October and early November) will be a critical barometer for measuring corporate strength as we head into the new year. We anticipate another strong earnings season for companies with strong balance sheets, low debt, and positive earnings and cash flows. Earnings for our energy holdings will be particularly interesting, as we expect large EPS surprises following the latest quarter of elevated crude prices. Q3 earnings should set the stage for how the market anticipates a recession (or lack thereof) and will be the primary driver of equity performance beyond Fed action and inflation data.
Geopolitics
The last two years have been tumultuous periods of geopolitical stress, and we expect that to continue into Q4 and the new year. Tensions with China have moderated to some extent but remain high, and any action they might take against Taiwan will be closely watched. We expect the war between Russia and Ukraine to drag on without a compromise in sight. Further, we will be monitoring the actions of international central banks as they combat inflation worries of their own. The U.S. doesn’t have the only central bank unleashing higher rates, and the strength of the U.S. dollar will largely depend on the actions of Western countries and our primary trading partners.
Domestic Politics/Government Shutdown
U.S. politics have been contentious recently, to say the least. With a narrow margin of control in both the House and Senate, legislation frequently requires bipartisan support. This is typically positive for markets as gridlock prevents major (and costly) regulatory overhauls. However, when it comes to passing a budget, this gridlock creates an issue and the potential for government shutdown. The U.S. avoided a shutdown at the end of September via a stopgap package that extends the budget until November 17th. A government shutdown has happened in the past – most notably in 2018-2019 – and will likely happen again in the future, but we don’t expect it to have a seriously negative impact on financial markets. In the case of a shutdown, many government workers will continue to work without pay until a resolution is reached, but even then, backpay will be issued upon a new budget deal. The largest downside (from our perspective) of a shutdown is the lack of published economic data. The absence of major reports, such as the jobs reports and CPI inflation reports, could leave a data-hungry market itching for news to drive markets. All in all, we expect a potential shutdown to be relatively short in duration and to have minimal impact on our portfolios.
Conclusion
As 2023 heads into its final calendar quarter, we remain cautious but feel more optimistic than we have up until this point. Inflation is moderating, the Fed is at the peak of its hiking cycle, the economy remains strong, and corporations continue to provide solid earnings. We will continue to scrutinize our portfolio companies and position portfolios to succeed amidst this heightened volatility. 2024 is in sight, and we wish you all a very happy few final months of your year!
Notes and Disclosures
This material represents an assessment of the market and economic environment at a specific point in time and is not intended to be a forecast of future events, or a guarantee of future results. Forward-looking statements are subject to certain risks and uncertainties. Actual results, performance, or achievements may differ materially from those expressed or implied. Information is based on data gathered from what we believe are reliable sources. It is not guaranteed as to accuracy, does not purport to be complete and is not intended to be used as a primary basis for investment decisions. It should also not be construed as advice meeting the particular investment needs of any investor. Past performance does not guarantee future results.
Indices are unmanaged and investors cannot invest directly in an index. Unless otherwise noted, performance of indices does not account for any fees, commissions or other expenses that would be incurred. Returns do not include reinvested dividends.
The Standard & Poor’s 500 (S&P 500) Index is a free-float weighted index that tracks the 500 most widely held stocks on the NYSE or NASDAQ and is representative of the stock market in general. It is a market value weighted index with each stock’s weight in the index proportionate to its market value.
Core inflation represents the long run trend in the price level. In measuring long run inflation, transitory price changes should be excluded. One way of accomplishing this is by excluding items frequently subject to volatile prices, like food and energy.
The Consumer Price Index (CPI) is a measure of inflation compiled by the US Bureau of Labor Studies.
Investments in commodities may have greater volatility than investments in traditional securities, particularly if the instruments involve leverage. The value of commodity-linked derivative instruments may be affected by changes in overall market movements, commodity index volatility, changes in interest rates or factors affecting a particular industry or commodity, such as drought, floods, weather, livestock disease, embargoes, tariffs and international economic, political and regulatory developments. Use of leveraged commodity-linked derivatives creates an opportunity for increased return but, at the same time, creates the possibility for greater loss. Consumer Price Index for All Urban Consumers (CPI-U): U. S. city average, by detailed expenditure category including food, energy, appliances, apparel, transportation, shelter, recreation, medical, education, etc.
1FactSet Insights