In this note, we explore the under-representation of certain sectors in the S&P 500 and why we believe it is important to diversify sector exposure given the disproportionate weights in the makeup of today’s S&P 500 index – leading us to our market of stocks vs. stock market comparison. We explain our investment philosophy and how outsized gains in smaller sectors can mean big benefits for our portfolios. Finally, we make a brief note about value-weighted vs. price-weighted indexes and which are the “best” to reference.
A Market of Stocks
Frequently we get the question “Where do you think the market is going?” Of course, we expect our clients and prospective investors want to know which direction the S&P 500 is going in the near term and how green (or heaven forbid) red it might be, and we certainly think that is important. What we think is a much better question, however, and one we are much more excited to discuss is: “Where do you think my portfolio is going?”. The “market”, typically, colloquially referring to the S&P 500 index, isn’t what we believe to be the most exciting topic in today’s investing environment. Rather, we believe it’s which companies we pick out of the market that is truly exciting to discuss.
If we believe the Fed is relatively resolute in its plan to quash inflation and we won’t experience a significant pivot in monetary policy for some time, then we should expect the S&P 500 to be relatively range-bound for the next year or so. We believe – as many do across Wall Street – that overall S&P 500 earnings will remain relatively flat next year as we enter a softer economic environment and potential light recession. If the market stays within the 17x to 18x price-to-earnings range on $230 of estimated earnings per share, then we would expect the S&P 500 to stay around the range of 3910 to 4140. The S&P 500 is trading at 4071 as of the 12/02/22 close, which leaves little upside and why we prefer to look at the S&P 500 as a market of stocks rather than the monolithic stock market as it is traditionally referenced. In a relatively flat S&P 500 environment, it is still possible to see portfolio appreciation by investing in the right sectors and companies, which is why dedicated analysis is currently so important.

Our Investment Philosophy
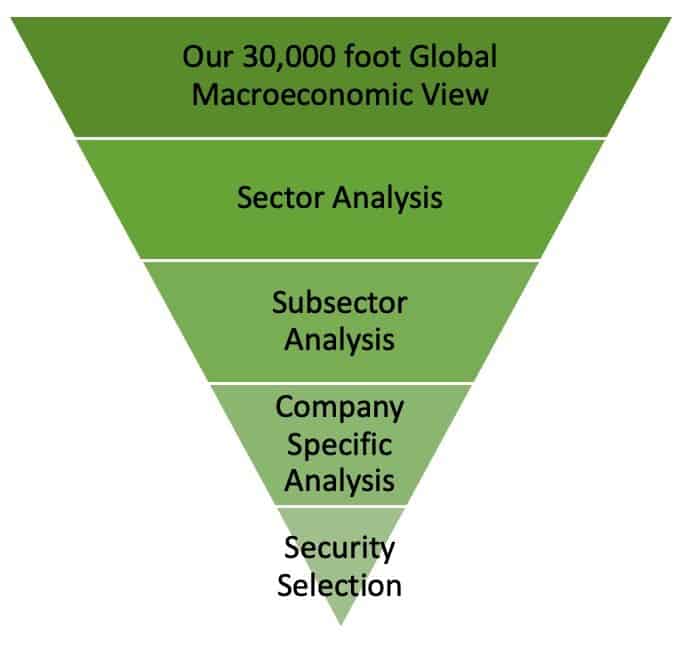
To build our portfolios, and thus arrive at our more exciting topics of conversation, we follow a specific rubric. Our investment philosophy starts with a 30,000-foot view of the economy and our analysis transitions top-down from a macro to a micro view. The companies that make it through our analysis funnel are the ones we’ve determined to be the best places to put our dollars – from geographic preference, to sector, subsector, and finally company-specific levels. We expect and intend for our portfolios to look quite different from the S&P 500, believing that by choosing the right stocks within the market we can exceed what the index can do in any given year (assuming that is the goal, but we have many different clients, goals, and portfolios).
Especially today, we feel market dynamics lend themselves to a stock-picking environment where certain sectors will be favored while others are hindered. This is traditionally the case but is accentuated now that we have left the era of easy money. We believe sectors like Technology and Consumer Discretionary that benefitted from cheap debt and a growing money supply will no longer have the same success in our new age of tighter monetary policy. On the other hand, sectors like Energy, Real Estate, and Healthcare should prove to be more resilient. By seeking to maximize investment in sectors and companies with a positive outlook and by limiting the losers, we believe our portfolios can outperform.
Investing in Smaller Sectors
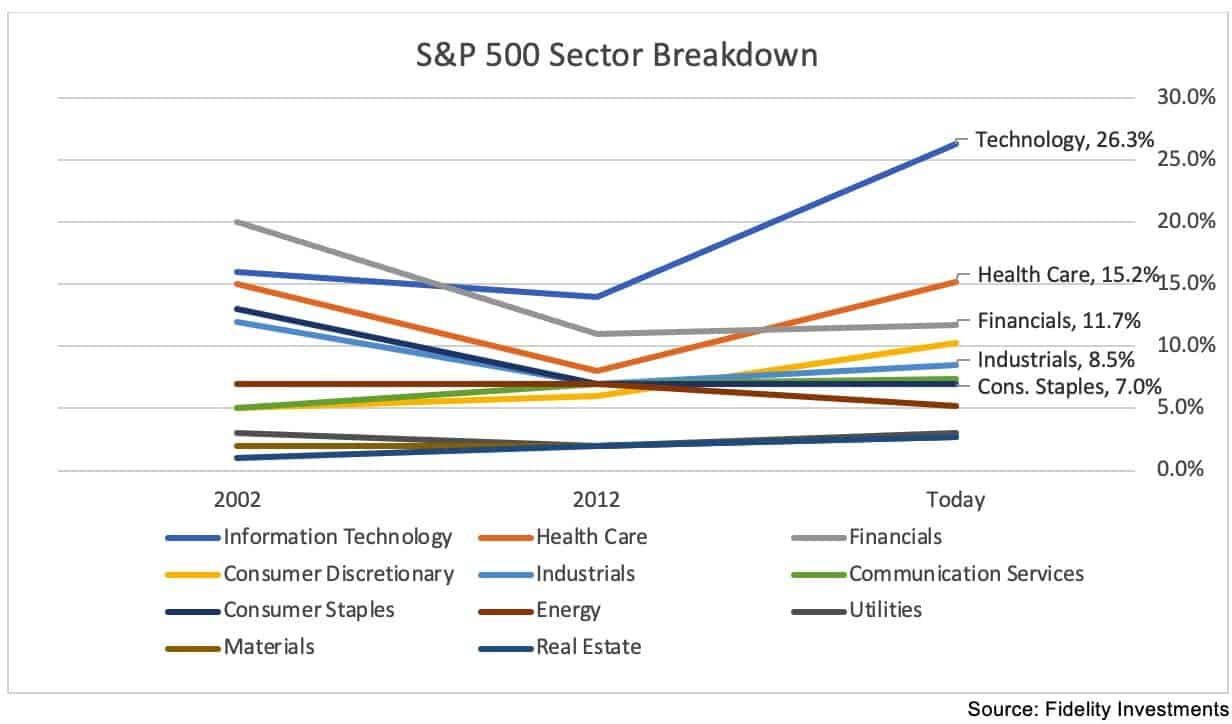
As we’ve mentioned in previous articles, two of our preferred sectors in the market are Energy and Real Estate. We have our preferences within those sectors, but it is important to note generally that Energy and Real Estate only make up 5.2% and 2.7% of the S&P, respectively. On the other end of the spectrum, Information Technology, a sector we are currently underweight in, makes up 26.3% of the index. As of 11/28, SPY is down -15.7%. XLE, an ETF representing the Energy sector is up 66.1%, and XLK, an ETF representing the Technology sector, is down -24.3%.

We believe investing in smaller sectors strategically is critical when those sectors are in-favor. Traditional index investing may not provide enough exposure to these in-favor sectors to make a difference in one’s portfolio. For example, a 50% advance in both the Energy and Real Estate sectors would currently only translate into a +3.95% return for the S&P 500 index. If at the same time, the IT sector were down only ~15%, it would reflect a -3.96% downside for the S&P. So, assuming all other sectors are flat, a 15% decrease in IT would completely offset 50% advances in both the Energy and Real Estate sectors.* This imbalance in sector weight has the potential to be a major disadvantage in today’s market environment. In the days when Technology was in-favor, index investing had a weighting-based tailwind, but today the opposite is true.
Historical Change in S&P 500 Weightings
When we look at the S&P 500 over the last 20 years, diversification was historically better among sectors, but still remained limited for smaller sectors like Energy, Real Estate, and Materials. Information Technology has become such a large piece of today’s S&P 500 proverbial pie, that index investors become de-facto tech-heavy investors, perhaps without being completely aware of it. We aren’t arguing against utilizing any kind of broad-market exposure such as an S&P 500 ETF as a portion of a portfolio, but in the current market we are keeping our broad-market investment limited to help improve diversification among sectors and pursue improved risk-adjusted returns.

A Review of Price-Weighted vs. Value-Weighted Indexes
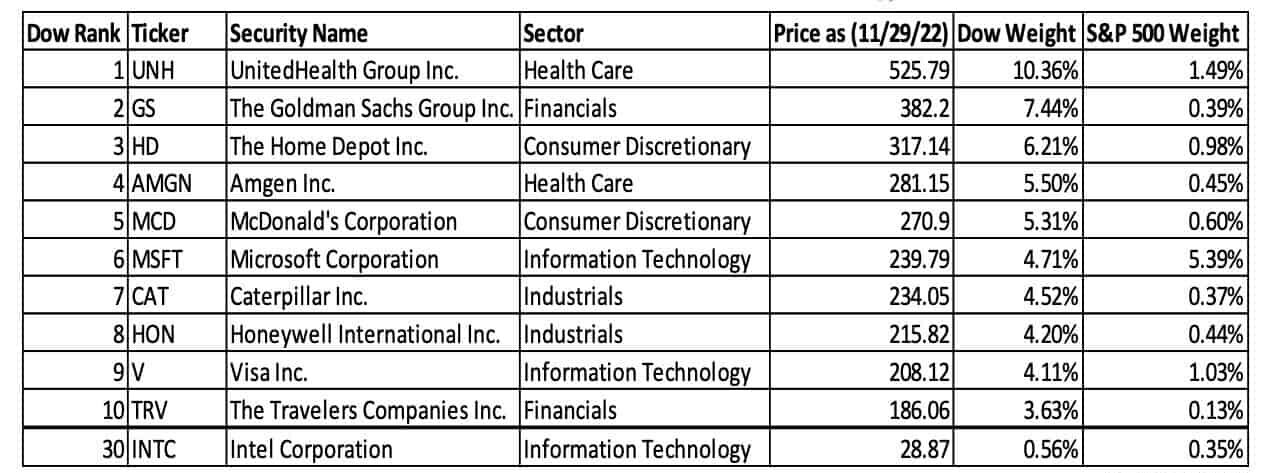
When we do speak to our clients about the market as a whole, we prefer to reference a value-weighted index, such as the S&P 500. To our dismay, we still frequently hear major news media and business outlets quote the Dow Jones Industrial Average (Dow) when they choose to convey market performance. The Dow is a price-weighted index, which we believe provides an unbalanced and inappropriately biased indicator compared to the value-weighting used in the S&P 500 or Nasdaq. In a price-weighted index, the market price of a security determines its proportional weight in the index.

Source: Koyfin
The Dow is already limited in its scope, with only 30 companies in the index, however, when compared to S&P 500 weightings we can see how disproportionately some companies impact the Dow. Value-weighted indexes give companies proportional representation based on their size (market capitalization). This is a better representation of how much a company truly impacts the entire market. For example, Apple (AAPL) has a market capitalization of $2.25 Trillion and represents 6.5% of S&P 500 market cap and therefore 6.5% of S&P 500 price movement. It is the top contributor to the S&P, but in the Dow, it ranks 19th and only makes up only 2.8% of price movement while it is 23% of the Dow’s market cap. Alternatively, Goldman Sachs (GS) has a $135 Billion market cap (only 1.3% of Dow market cap), but because of its larger per-share price tag, ranks second in the Dow at 7.44% of the price movement, while ranked 57th in the S&P 500 with a 0.39% price contribution. The bottom line is it’s the size of the company that matters most when looking at market fluctuations and we recommend value-weighted indexes like the S&P as a proxy for U.S. market movements.
Conclusion
While it remains important to speak to the market as a whole and reference broad indices, we are much more interested in our personal portfolio positioning. It can be easy to follow headline numbers like the S&P 500, Nasdaq, and Dow Jones, but especially today, the most exciting sectors are getting lost in the noise. When we must discuss broad markets, our preference is the S&P 500 as a value-weighted index, but we would encourage investors not to be discouraged by what may likely be a stagnant market over the next year, and rather turn to, as we do, their own portfolios and which sectors of the economy are the exciting areas to invest hard-earned dollars.
Disclosures
*To calculate sector contribution to the S&P 500, Energy Sector contribution of 5.2% was multiplied by 50% and added to Real Estate Sector contribution of 2.7% multiplied by 50% to arrive at 2.6% + 1.35% = 3.95%. A -3.95% contribution by the Technology Sector was calculated by multiplying the Technology Sector weighting of 26.4% and multiplying it by -15% which comes to -3.945%.
This material represents an assessment of the market and economic environment at a specific point in time and is not intended to be a forecast of future events, or a guarantee of future results. Forward-looking statements are subject to certain risks and uncertainties. Actual results, performance, or achievements may differ materially from those expressed or implied. Information is based on data gathered from what we believe are reliable sources. It is not guaranteed as to accuracy, does not purport to be complete and is not intended to be used as a primary basis for investment decisions. It should also not be construed as advice meeting the particular investment needs of any investor. Past performance does not guarantee future results.
The Standard & Poor’s 500 (S&P 500) is an unmanaged group of securities considered to be representative of the stock market in general. It is a market value weighted index with each stock’s weight in the index proportionate to its market value.
The Dow Jones Industrial Average (DJIA) is a price-weighted average of 30 actively traded “blue chip” stocks, primarily industrials, but includes financials and other service-oriented companies. The components, which change from time to time, represent between 15% and 20% of the market value of NYSE stocks.
Indices are unmanaged and investors cannot invest directly in an index. Unless otherwise noted, performance of indices do not account for any fees, commissions or other expenses that would be incurred. Returns do not include reinvested dividends.
Neither Asset Allocation nor Diversification guarantee a profit or protect against a loss in a declining market. They are methods used to help manage investment risk.
Past performance is no guarantee of future results. The investment return and principal value of an investment will fluctuate so that an investor’s shares, when redeemed, may be worth more or less than their original cost. Current performance may be lower or higher than the performance quoted.
Information is provided to illustrate typical sectors and securities in which the portfolio may invest. It should not be considered investment advice or a recommendation to buy or sell any security. There is no guarantee that securities remain in the portfolio or that securities sold have not been repurchased. It should not be assumed that any investments were profitable or will prove to be profitable, and past performance does not guarantee future results.
Sector funds invest in a limited number of companies and are generally non-diversified. As a result, changes in market value of a single issuer could cause greater volatility than with a more diversified fund.
Exchange-traded funds are sold by prospectus. Please consider the investment objectives, risks, charges, and expenses carefully before investing. The prospectus, which contains this and other information about the investment company, can be obtained from the Fund Company or your financial professional. Be sure to read the prospectus carefully before deciding whether to invest.
